IV Rank vs. IV Percentile: Which is Best?
IV Percentile shows how often implied volatility (IV) has been lower than today’s level over the past year, giving you a sense of frequency. IV Rank shows where today’s IV falls between the highest and lowest levels in the past year, indicating its placement.
💡 IV Rank & Percentile: Pro Takeaway
Before we break down IV Rank and IV Percentile, it's essential to step back and understand how implied volatility works in practice.
As an options trader, the rule of thumb is simple: sell high IV, buy low IV. But how do you know if an option's IV is currently priced too high or low?
For example, two stocks could both trade at $100 per share. The 100-strike call on one might show 15% IV, while the same strike on the other shows 45%.
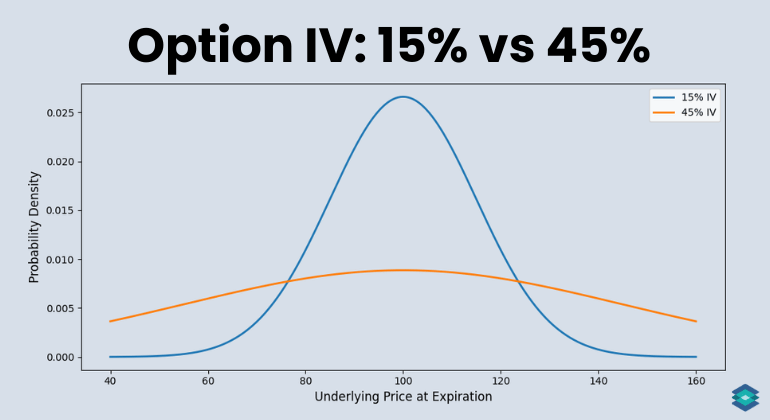
Does that mean ABC's options are cheap and XYZ's are expensive? Not necessarily. IV only makes sense when you compare it to its own history. That's where IV Rank and IV Percentile come in.
- IV Rank: Measures where today's implied volatility sits compared to its range over the past year (high minus low).
- IV Percentile: Shows the percentage of days in the past year when implied volatility was lower than it is now.
In this article, we'll cover everything you need to know about IV Rank and IV Percentile, including how to calculate them, when to use them, and which one gives the better read on volatility.
Highlights
- Implied Volatility (IV) is the market’s forecast of how much an asset could move, expressed as an annualized percentage.
- IV Rank shows where today’s IV sits within its one-year high and low range.
- IV Percentile shows the frequency, how often IV has been lower than it is now over the past year.
- Range vs. frequency is the key difference: Rank tells you placement, Percentile tells you context.
- Better gauge: If I had to pick, I’d lean on IV Percentile since it smooths out one-off spikes.
What is Implied Volatility?
Implied volatility (IV) is a forward-looking, annualized metric derived from option prices. It reflects the market’s expectation of how much the underlying asset could move over the course of a year. IV does not predict direction; it only reflects the magnitude of potential movement.
For example, take a look at the IV levels of SPX (S&P 500 Index) call options expiring in 7 days below on a TradingBlock options chain:
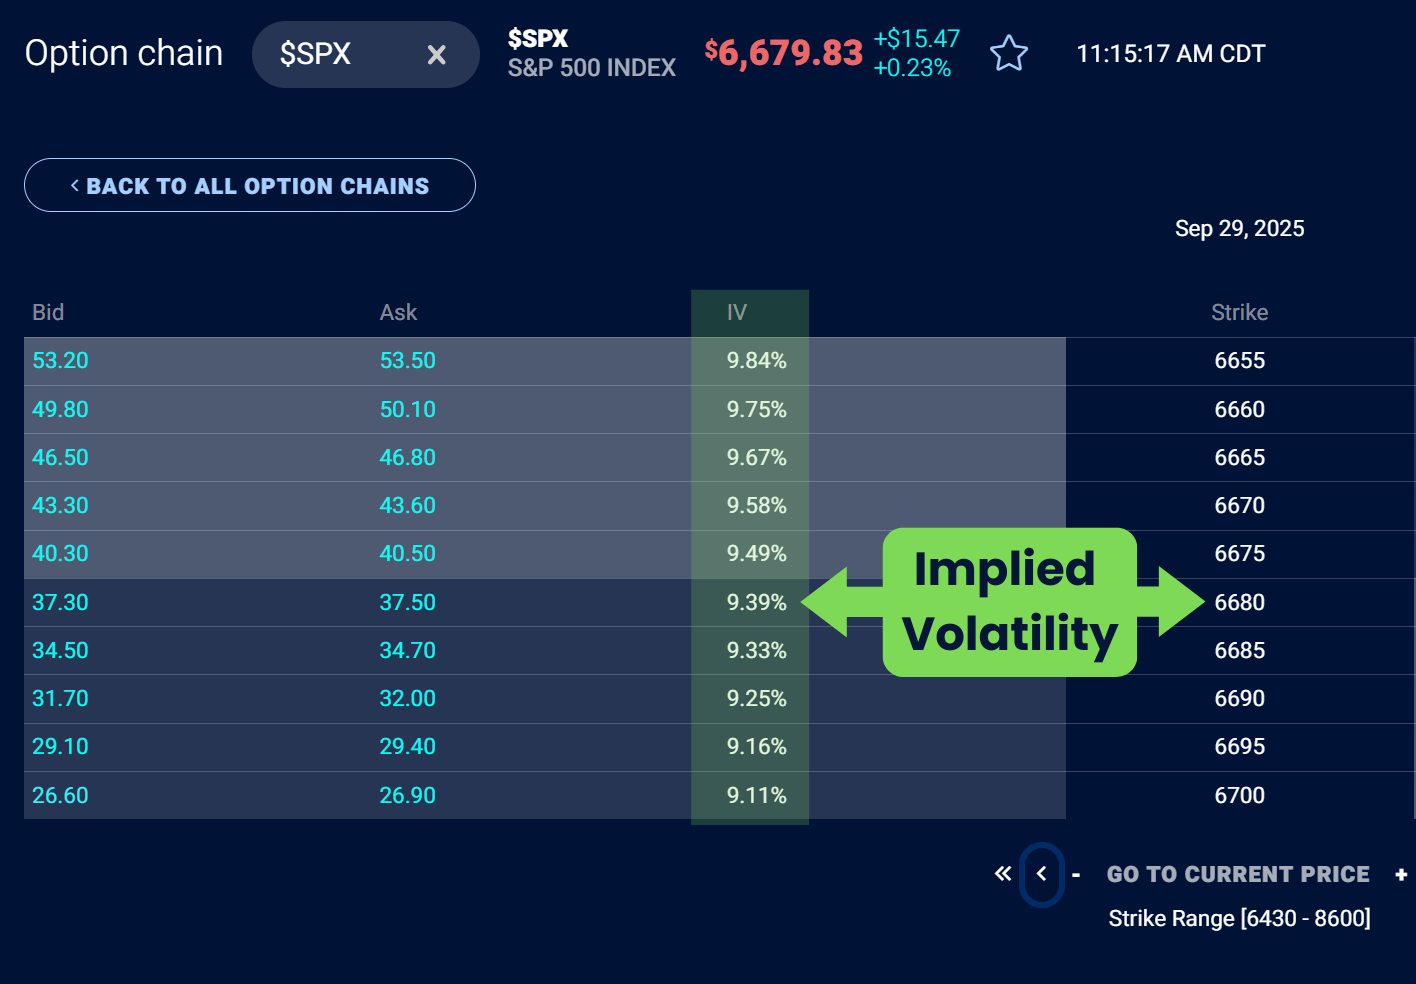
Let’s look at the at-the-money 6680 call option, which has an IV level of 9.39%. That number indicates that the market is pricing the option as if the SPX could move at a pace consistent with 9.39% annualized volatility. Over the next 7 days, this annualized figure scales down to a much smaller expected move, but the concept remains the same.
All of the options on the chain above expire in 7 days. You may wonder why the implied volatility changes slightly from one strike price to another. This is due to something called volatility skew. Skew reflects how the market assigns different probabilities and risk premiums to different strike prices, even when the expiration date is the same.
Generally speaking, at the money options best represent the overall IV for an expiration cycle.
Implied Volatility and Option Pricing
Since IV reflects the amount of movement a market expects, a higher IV generally leads to higher option premiums. Traders are willing to pay more when they anticipate bigger swings in the underlying.
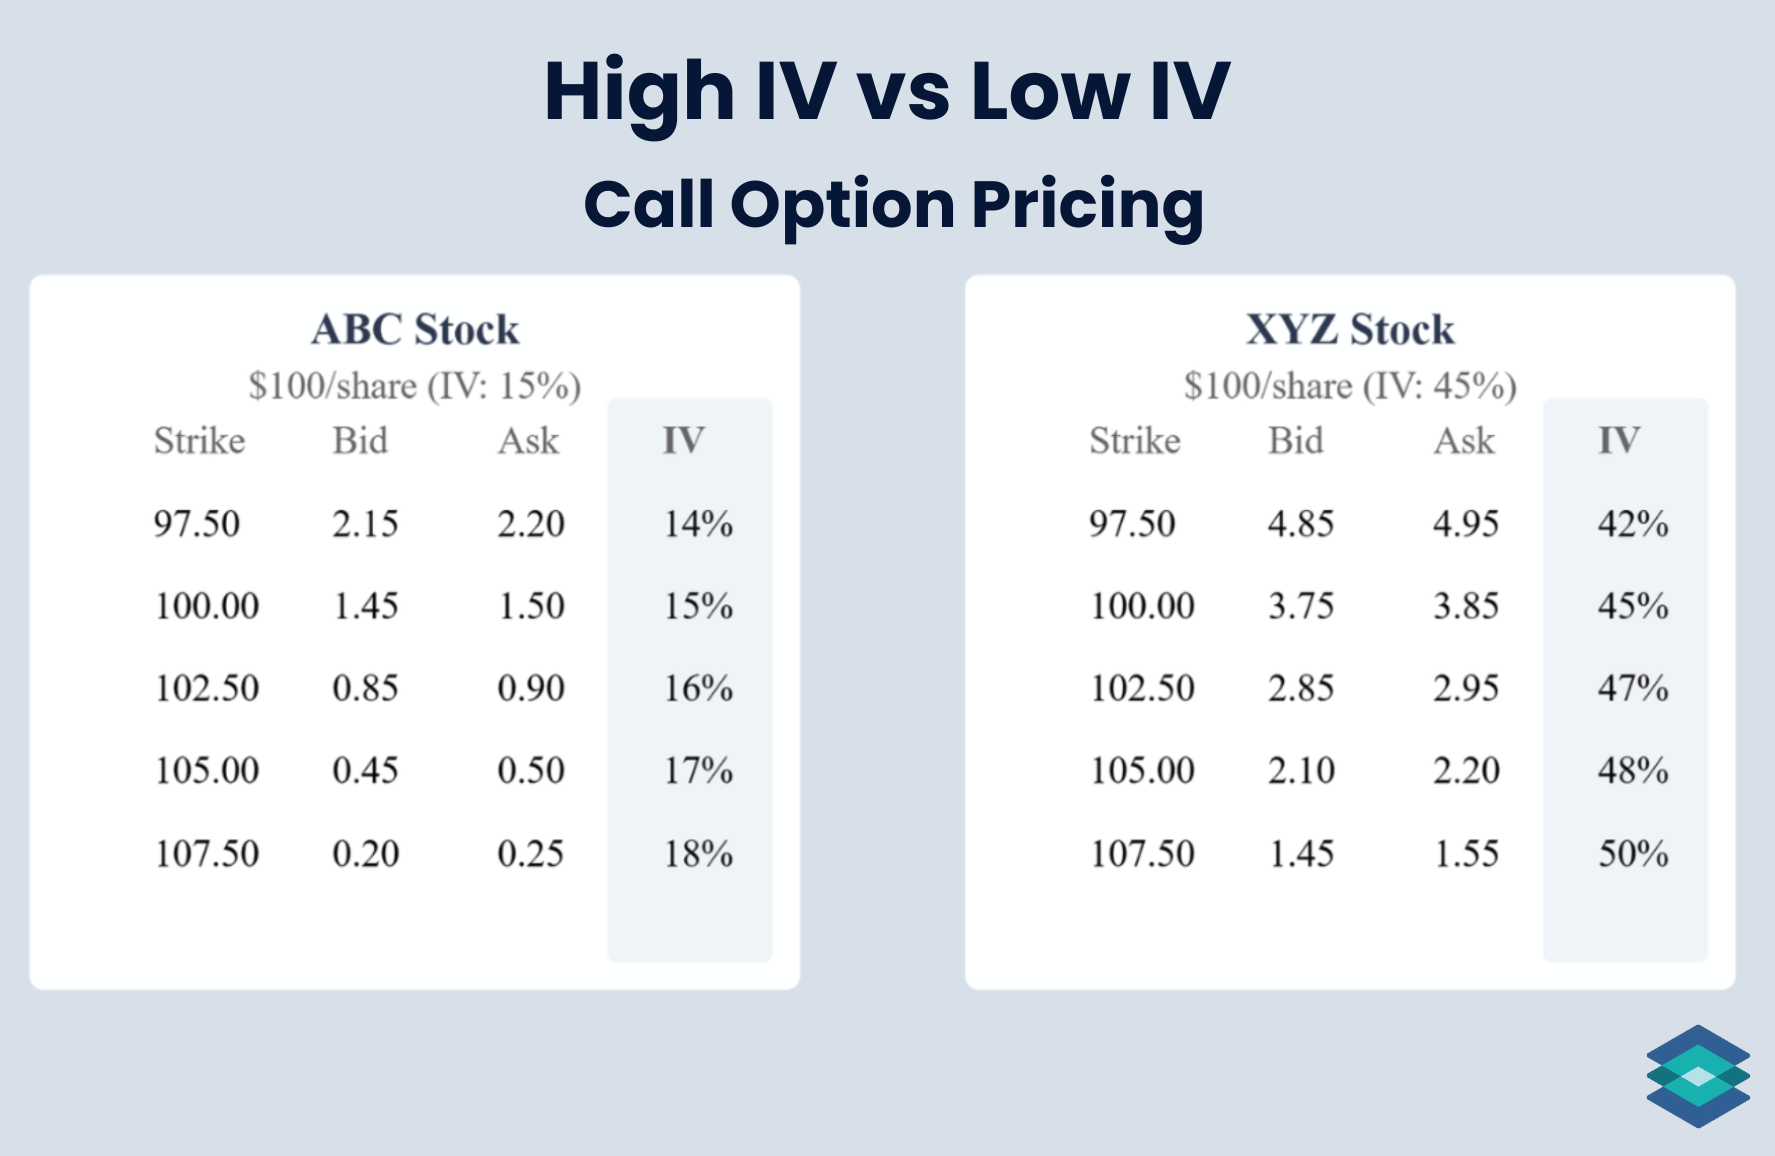
Some stocks are simply more volatile than others. For example, a newly listed tech startup after its IPO is much more likely to have an elevated IV compared to a stable value company.
We can see how IV varies below when comparing ABC and XYZ options, where both stocks are trading at $100/share:
Generally speaking, implied volatility tends to rise in the lead-up to major events, such as earnings announcements, employment reports, or Federal Reserve meetings. After the event passes, IV sometimes falls, resulting in a decline in option value.
But this pattern does not always hold. A surprise outcome, like an earnings miss, can cause IV to spike even after the news is released.
So far, we have learned that IV tells us the current expected move for an underlying asset. But relative to what? How do we know if today’s IV is historically high or low?
That is where IV Rank and IV Percentile come in.
What is IV Rank?
IV Rank measures where today’s implied volatility sits compared to its range over the past year (high minus low).
IV rank has a range of between 0% and 100%:
- 0% = current IV is at the 1-year low.
- 100% = current IV is at the 1-year high.
Here is how you calculate IV rank:
(Current IV – 1-year low) ÷ (1-year high – 1-year low) × 100
Low IV Rank Example
We’re going to look at options on ABC that expire in 7 days with a 21% IV:
- IV high: 40%
- IV low: 20%
- Current IV: 21%
- ABC = (21 – 20) ÷ (40 – 20) = 5%
The IV rank for these options is therefore 5%. This indicates that today’s IV for the 7-day expiration is very close to its one-year low, making those options relatively cheap compared to their historical performance.
These are options you probably want to buy, not sell. It doesn’t matter if you are net long call option or put options - the market is telling us that both are cheap, and it may be a good time to take a directional view; either up, down, or both.
High IV Rank Example
Now let’s look at options on XYZ that expire in 7 days with a 38% IV:
- IV high: 40%
- IV low: 20%
- Current IV: 38%
- ABC = (38 – 20) ÷ (40 – 20) = 90%
The IV rank for these options is 90%. This suggests that, historically speaking, these options have been very overpriced. I would consider a net credit trade here.
How Do I Use IV Rank?
Here are a few rules of thumb I go by:
- IV Rank above 50% → Premium is relatively expensive, sell options
- IV Rank below 25% → Premium is relatively cheap, buy options
What is IV Percentile?
IV Percentile shows the percentage of days in the past year when implied volatility was lower than it is now. In other words, it tells us how often IV has been cheaper than today. While IV Rank looks at where IV sits between its high and low, IV Percentile measures the frequency of IV levels over time.
Like IV rank, IV percentile has a range of between 0% and 100%:
- 0% = IV has never been lower in the past year.
- 100% = IV has always been lower in the past year (today’s IV is the highest level in 12 months).
Here’s how you calculate IV Percentile:
(Number of days IV was lower than today ÷ Total trading days in the past year) × 100
Let’s now look at a few examples.
Low IV Percentile Example
We’re going to look at options on XYZ that expire in 14 days, which currently have an IV of 25%:
- Total trading days in the past year: 252
- Days with lower IV than today: 25
- IV Percentile = 25 ÷ 252 × 100 = 10%
The IV Percentile for these options is 10%. This means IV has been lower only 10% of the time in the past year, so current IV is near the bottom of its range. Options are relatively inexpensive at this level, so I would likely establish a net debit position using either calls, put or both.
High IV Percentile Example
Now let’s look at the same options on XYZ that expire in 14 days, which currently have an IV of 25%:
- Total trading days in the past year: 252
- Days with lower IV than today: 227
- IV Percentile = 227 ÷ 252 × 100 = 90%
The IV Percentile for these options is 90%. This means IV has been lower 90% of the time in the past year, so the current IV is elevated. Options are relatively expensive at this level, so I would be a net seller of options here.
How Do I Use IV Percentile?
Here are a couple of rules of thumb I go by when it comes to IV percentile:
- IV Percentile above 75% → Premium is expensive. Selling strategies favored.
- IV Percentile below 25% → Premium is cheap. Buying strategies favored.
Strategies for IV Rank and IV Percentile
IV Rank and IV Percentile are great tools for determining which option strategies to deploy. A low reading in either suggests options are cheap, making net long positions more attractive. High readings indicate options are expensive, making credit (premium-selling) trades more favorable.
IV Rank vs IV Percentile: Which is Best?
The more data you have, the better. Therefore, it may be wise to use both IV Rank and IV Percentile when researching an options trade. Rank gives you a sense of where today’s implied volatility sits within the past year’s range, while percentile shows how often volatility has been lower than it is now.
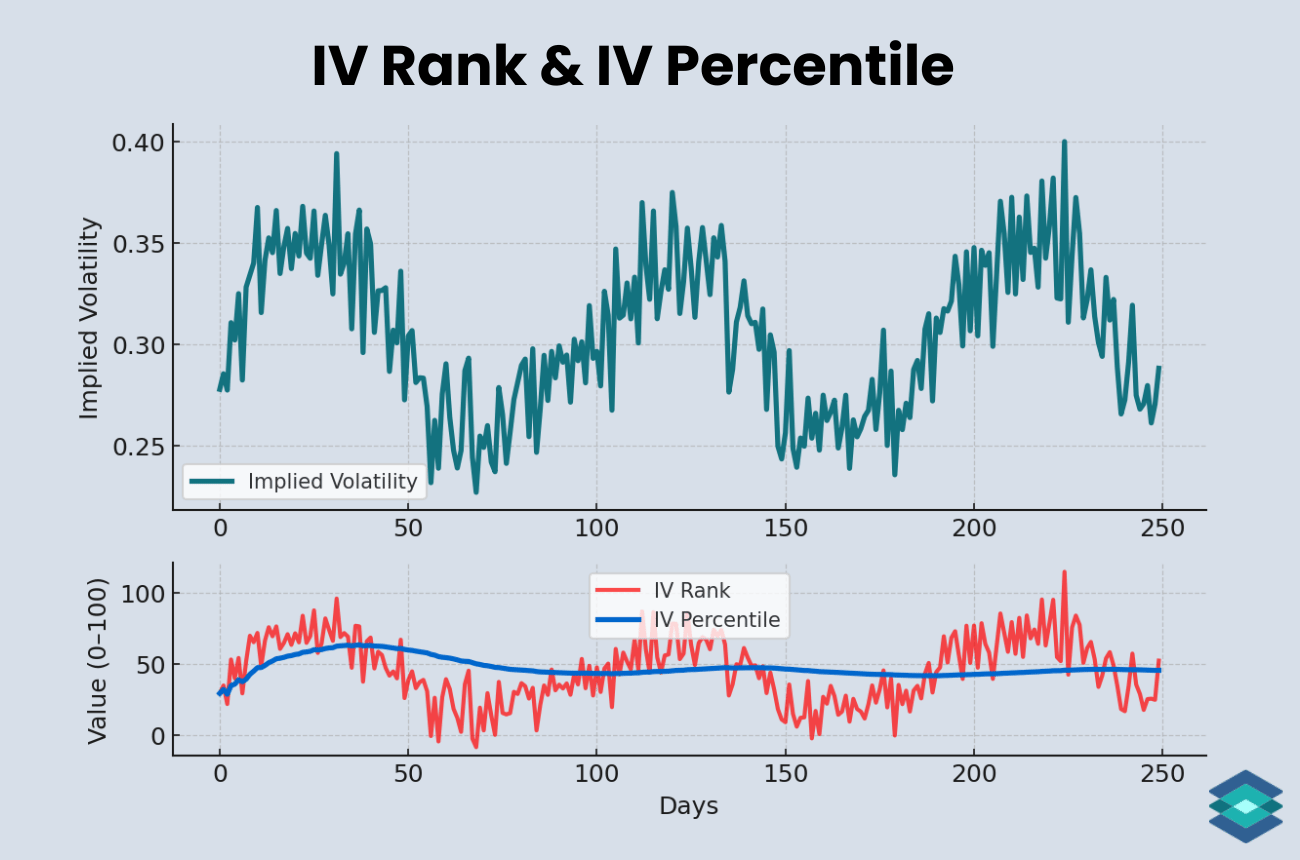
However, if you had to pick one, I’d say go with IV percentile. It’s less prone to distortion from one-off spikes or unusual extremes in volatility, as shown below on a TradingView chart of SMH (VanEck Semiconductor ETF).
.png)
- IV Rank (upper line) jumps around more when new highs or lows are made in implied volatility.
- IV Percentile (lower line) tells us how often IV has been lower than today. It is smoother because it reflects the distribution of volatility rather than just the extremes.
⚠️ Options trading involves significant risk and is not suitable for all investors. Outcomes can be affected by assignment risk, commissions, fees, and slippage, which are not reflected in the examples. Always read The Characteristics and Risks of Standardized Options before trading.
FAQ
IV Rank and IV Percentile are both tools traders use to judge whether implied volatility is high or low. IV Rank compares today’s IV to its 1-year range, while IV Percentile shows how often IV has been lower over the past year.
This depends on the options strategy you are deploying. If you expect implied volatility (IV) to go down, you may want to be a net seller of options. If you expect IV to go up, you may want to put on a net debit position.
IV stands for implied volatility. Implied volatility is a forward-looking, annualized metric derived from option prices. It reflects how much the market expects the underlying asset to move over a given time period.
IV percentile shows the percentage of trading days in a given period (usually 1 year) when a stock's implied volatility was lower than its current level.
You use IV Percentile to judge whether options are historically cheap or expensive. A high percentile (above ~75%) suggests options are pricey and favors selling strategies, while a low percentile (below ~25%) suggests options are cheap and favors buying strategies.
Here is how you calculate IV Percentile: (Number of days IV was lower than today ÷ Total trading days in the past year) × 100

.png)


.png)