Covered Put Options Strategy: Beginner's Guide
The covered put is an options strategy that lets short sellers collect income by selling put options against their short stock. The premium collected reduces the position’s cost basis while capping further downside profits.

The covered put strategy consists of selling one put option for every 100 shares of stock or ETF sold short. It is a bearish strategy that generates income from the put premium, but caps profit once the stock falls below the strike price.
Highlights
- Risk: Upside risk is unlimited since short stock losses have no cap. The short put only reduces risk by the small premium collected.
- Reward: Profit is capped once the stock falls to the put strike, since losses on the short put offset further downside gains.
- Outlook: Works best for traders who are moderately bearish and want to collect income while holding a short stock position.
- Time Decay: Theta works in your favor on the short put as its extrinsic value erodes over time, assuming the stock price and implied volatility stay unchanged.
- Assignment Risk: American-style options like stocks and ETFs can be exercised early, which may negate your short stock. If assigned, you’re left flat.
💡 Covered Put: Pro Takeaway
The covered put position is often used by medium to long-term bearish traders looking to collect income from a short position. It involves selling one out of the money put for every 100 shares of stock sold short.
For example, let's say we're short 100 shares of ABC at $100. To collect income, we sell the 95 strike price put for a $0.50 credit with 90 days to option expiration:
Trade details:
- Short 100 shares of ABC at $100
- Sell 1 ABC 95 put @ $0.50
- Expiration: 90 days
Outcomes:
- Above $95: Put expires worthless, keep $0.50 premium
- Below $95: Assigned at $95, eliminates short stock
- Max profit: (100 – 95) + 0.50 = 5.50 per share → $550 total
- Breakeven: 100 + 0.50 = 100.50
- Risk: Unlimited if stock rises
The covered put works best when you're moderately bearish but expect limited near-term movement. If your outlook is aggressively bearish, a straight short stock or buying puts may be more effective.
In this article, we'll cover everything you need to know about the covered put—when to use it, how to set it up, how to manage it, and some go-to tips for making it work.
Covered Put: Trade Components
Here’s how you build a covered put:
- Short 100 shares of stock
- Sell 1 out of the money put (collects income, reduces cost basis)
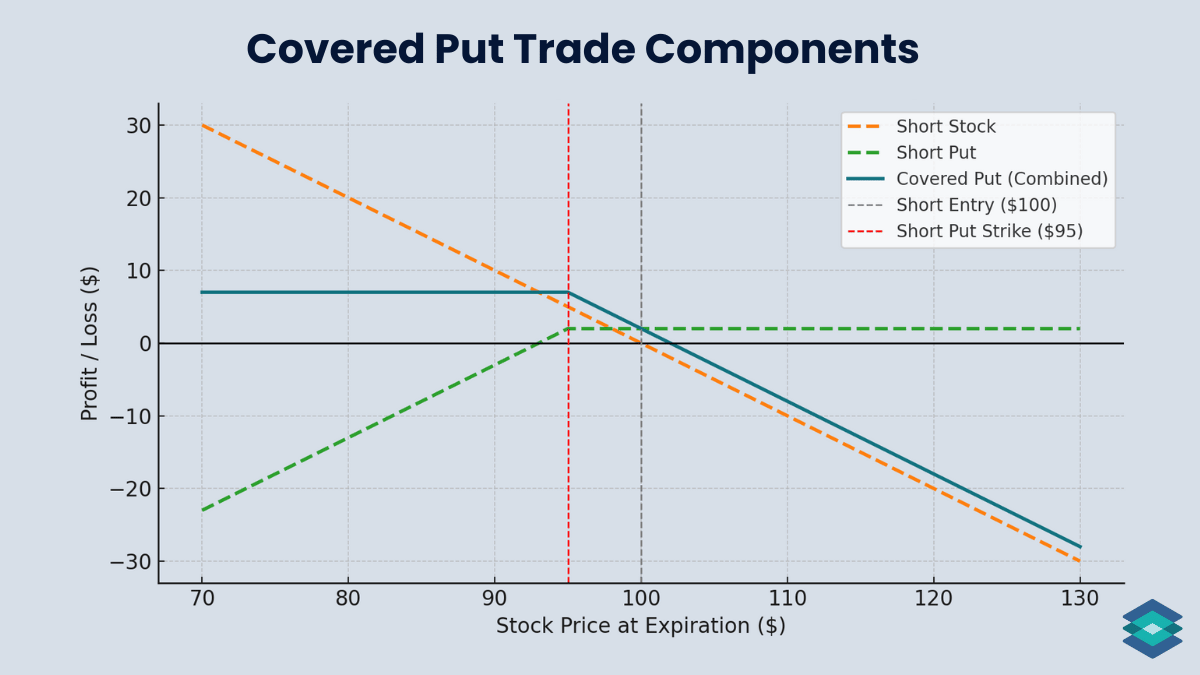
The short put adds premium income and an obligation to buy shares below the strike. Together with the short stock, the covered put brings in income on a bearish outlook, slightly improves breakeven, but still carries unlimited upside risk.
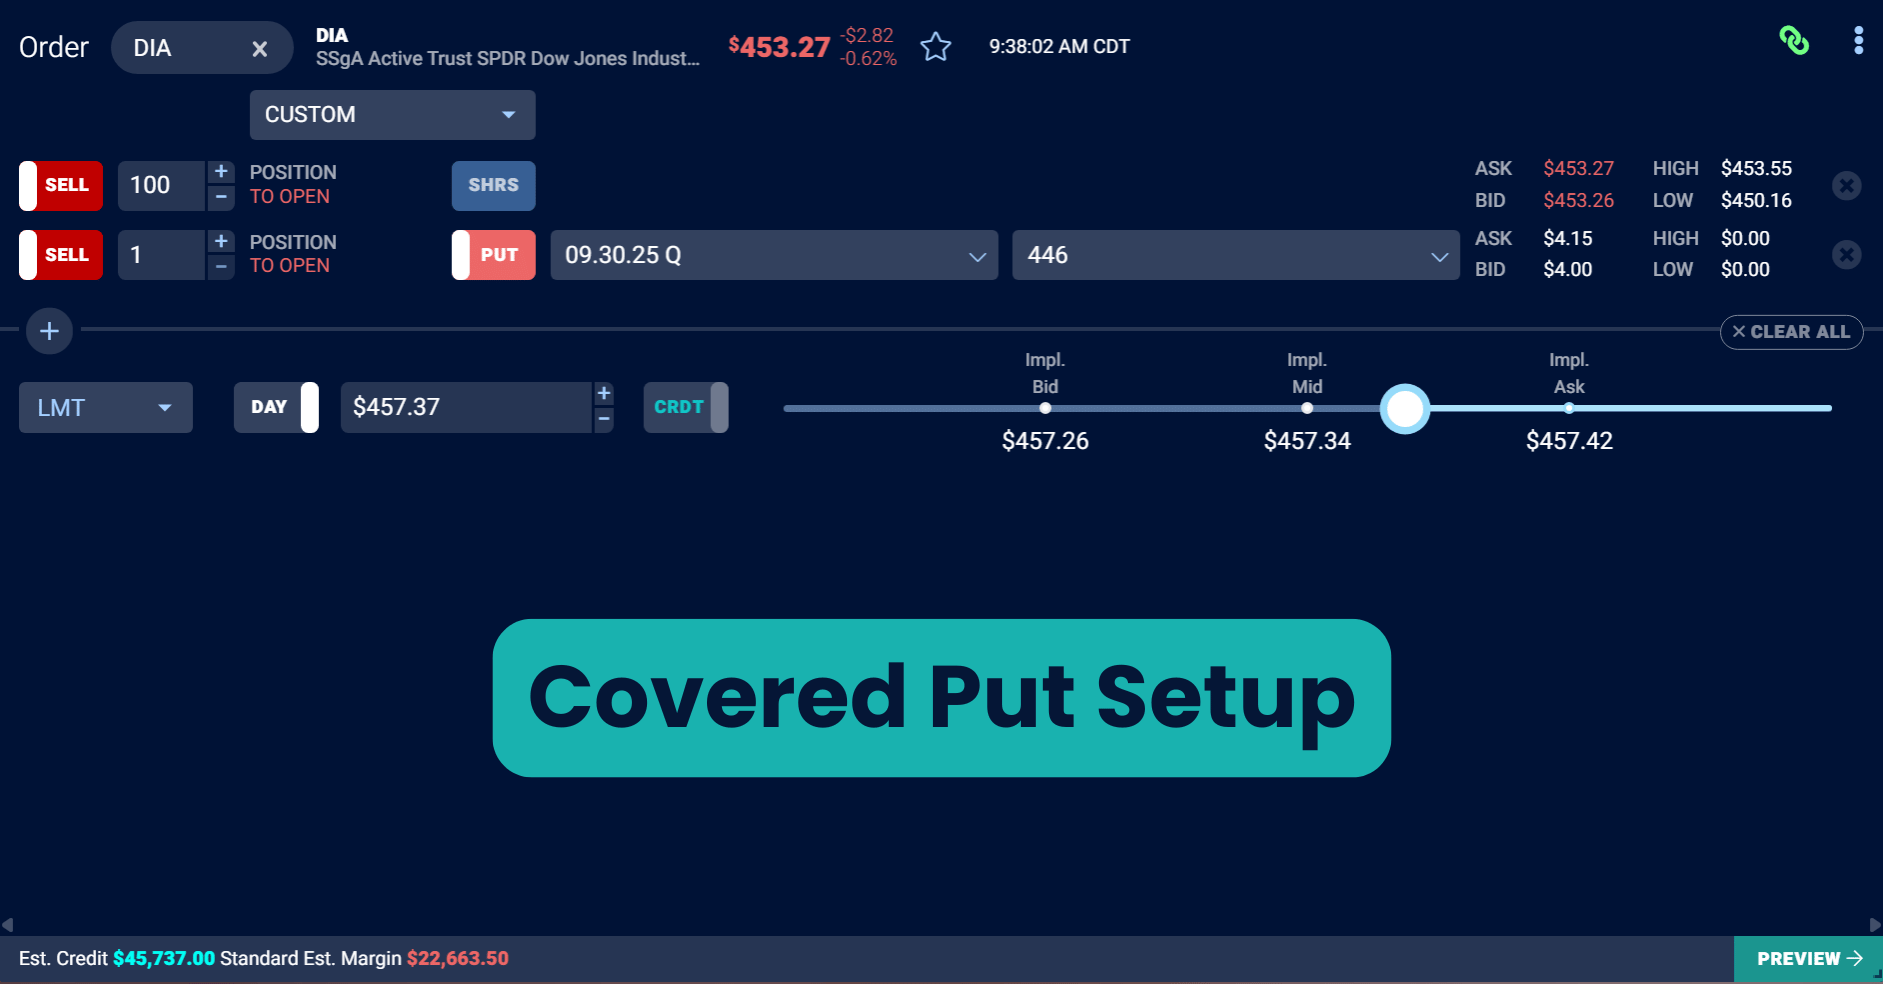
Most traders sell puts against stock already owned, but you can also enter a covered put in one trade, as seen below on the TradingBlock dashboard:
Outlook: When to Trade Covered Puts
The covered put is a bearish income trade. It works best when you expect the stock to drift lower or stay flat, but not stage a sharp rally.
Here are a few situations where selling a put against short stock may make sense:
- Income on Short Stock: Brings in premium while you hold a bearish position.
- Breakeven Improvement: The premium slightly cushions losses if the stock rises.
- Target Price Patience: Lets you collect income while waiting for the stock to fall to your preferred buy-back level.
Covered Put Payoff Profile
Let’s now take a closer look at this strategy's max loss, max profit, and breakeven zones.
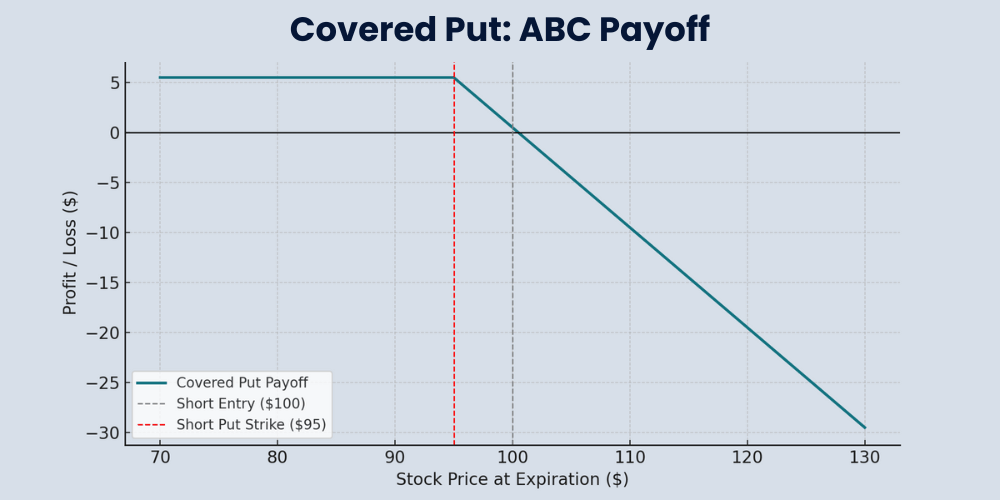
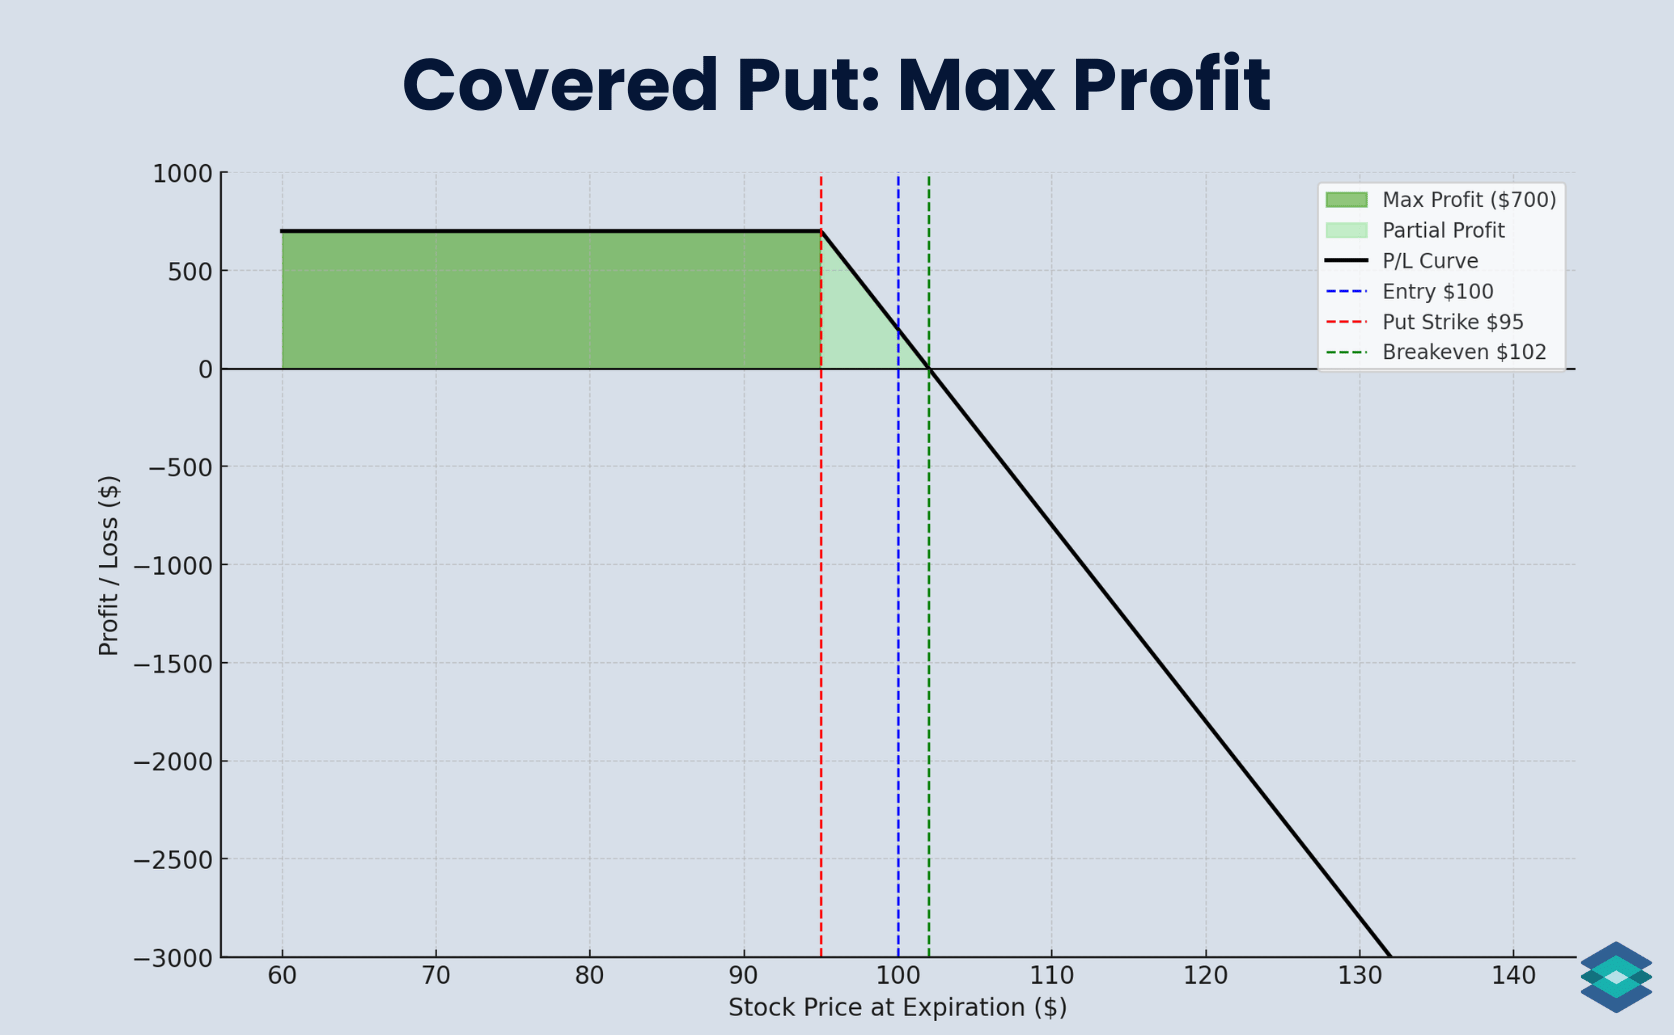
Covered Put: Max Profit Zone
The covered put reaches its maximum profit once the stock falls to the short put strike. At that point, further downside gains from the short stock are offset by losses on the short put.
- Max Profit = (Short Entry Price–Put Strike) + Premium Collected
For example, let’s say ABC is trading at $100. You are short 100 shares at $100 and sell the 95 put for $2. If ABC finishes at $95, you earn $5 from the short stock plus $2 from the premium, for a total of $7/share ($700). Any price below $95 locks in the same $700 profit.
We can see this below:
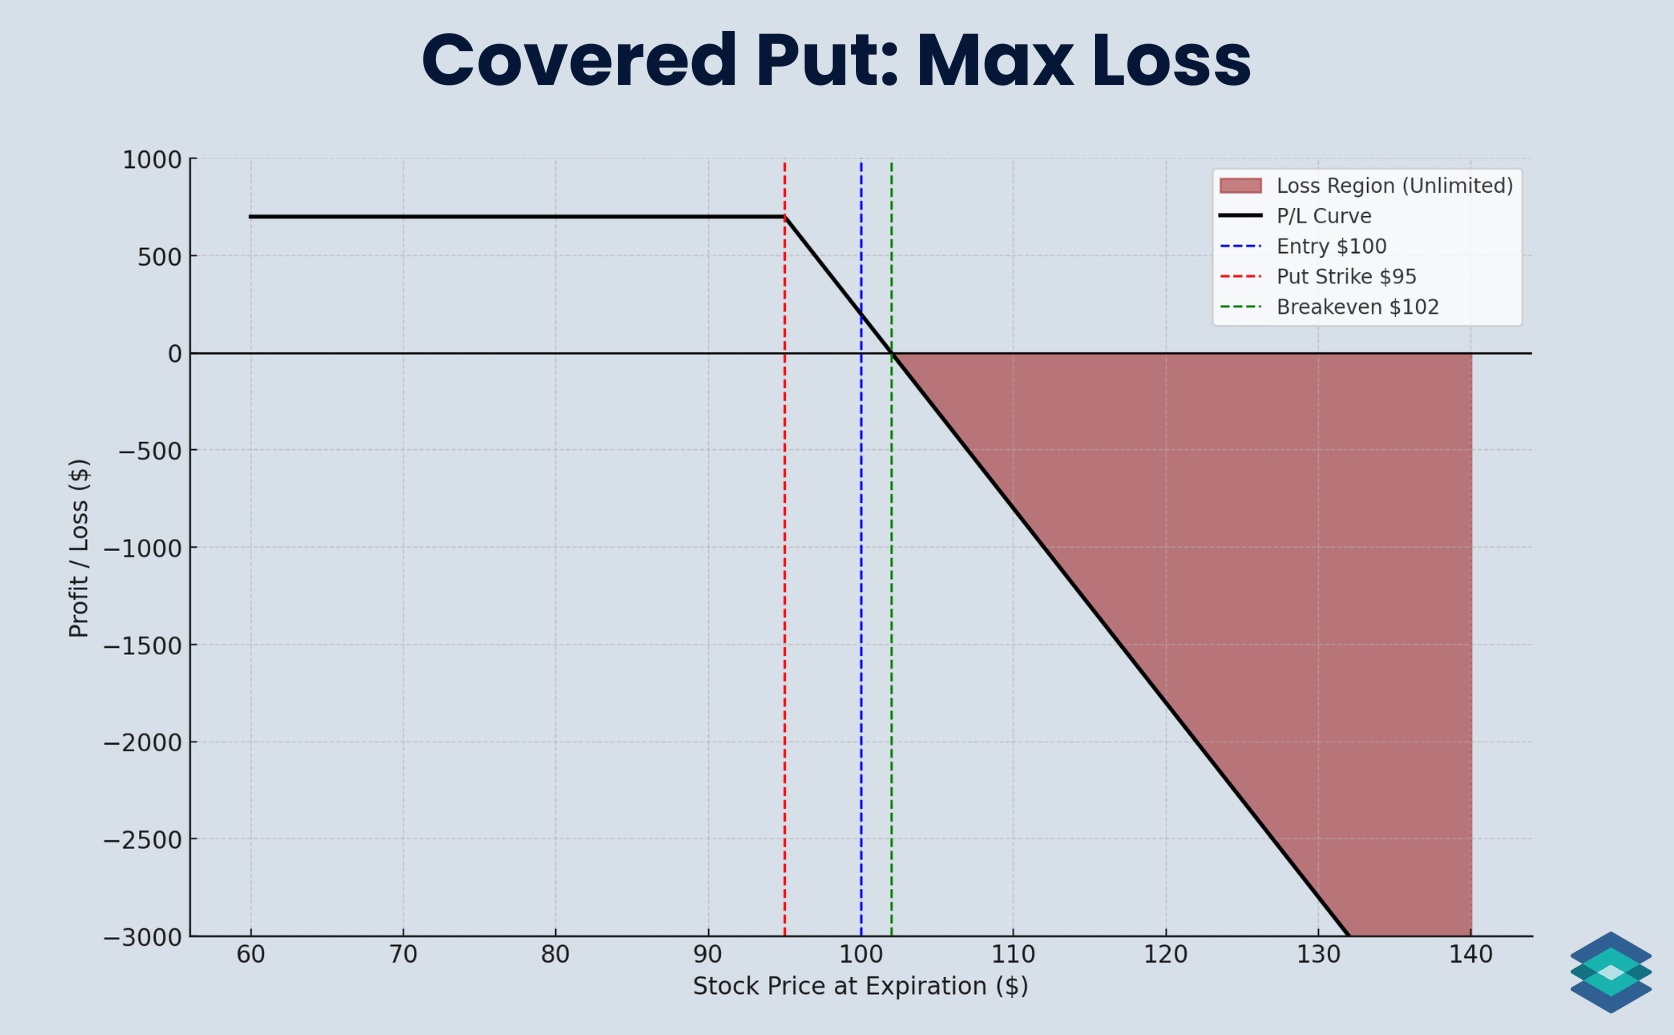
Covered Put: Max Loss Zone
The maximum loss on a covered put is unlimited because there is no limit to how high a stock or ETF can rise. The short put reduces risk only by the amount of premium you collect.
- Max Loss = Unlimited if stock rises
For example, if ABC from our previous example rallies to $110:
- Short Stock Loss: $10 per share ($1,000)
- Premium Collected: $2 per share ($200)
- Net Loss: $800
Losses continue to grow if ABC rises further. We can see this below:
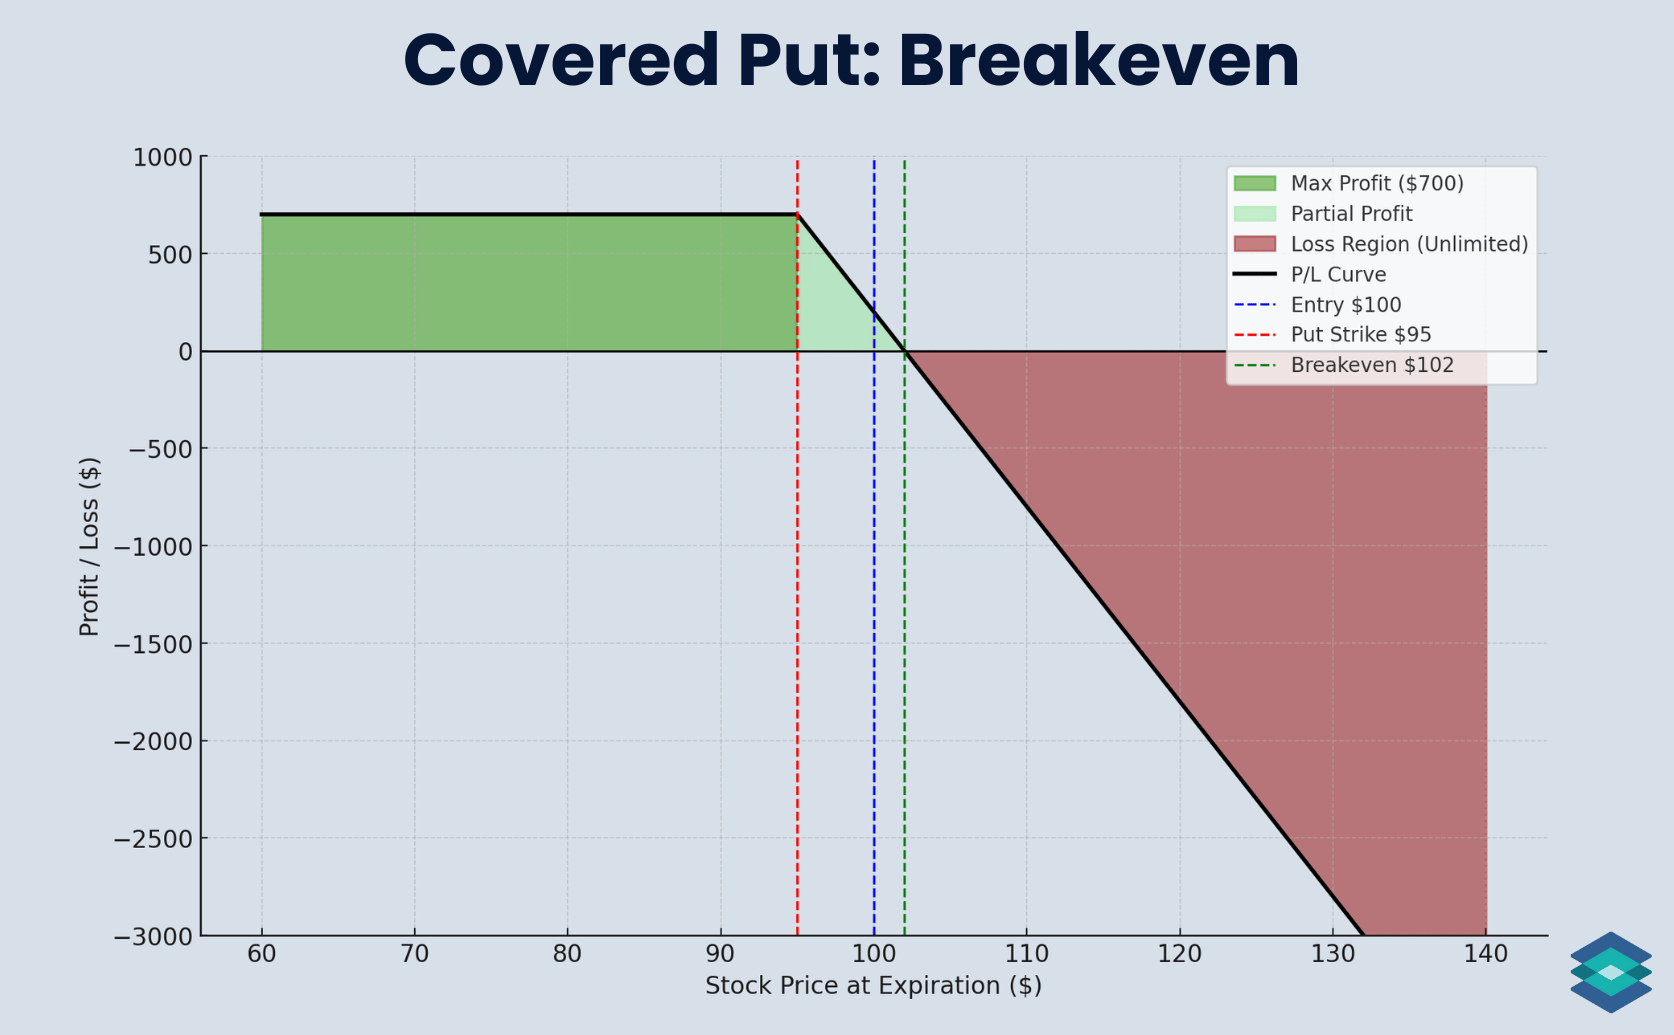
Covered Put: Breakeven Zone
Breakeven on a covered put is the short stock entry price plus the premium collected.
- Breakeven = Short Stock Price + Premium Collected
Using our trade:
- Short Stock Price: $100
- Premium Collected: $2
- Breakeven: $102
If ABC finishes at $102, the $200 loss on the short stock is offset by the $200 premium collected, leaving you flat. Above $102, the position loses money. Below $102, the position is profitable.
We can see this below:
Covered Put Margin Requirements
On a covered put trade, the margin requirement comes from the short stock. Selling a put against it doesn’t add margin and can even lower the cost a bit, since the premium collected raises your breakeven.
- Short stock margin: Typically 50% of the short stock’s notional value when you open the trade, with maintenance margin usually around 30%.
- Short put margin: No additional requirement if the put is fully covered by your short stock.
Covered Put: Real World Trade Example
In this example, we’re going to sell a covered put on SMH (VanEck Semiconductor ETF). The ETF has just begun to sell off from record highs, and we believe the longer-term trend is still lower.
In the short term, over the next month, we are neutral to mildly bearish. To collect some income while we wait for the sell-off to develop, we will sell a put option against our short stock.
Let’s head over to the TradingBlock dashboard and find a 5% out of the money (OTM) put option to sell on the SMH options chain:
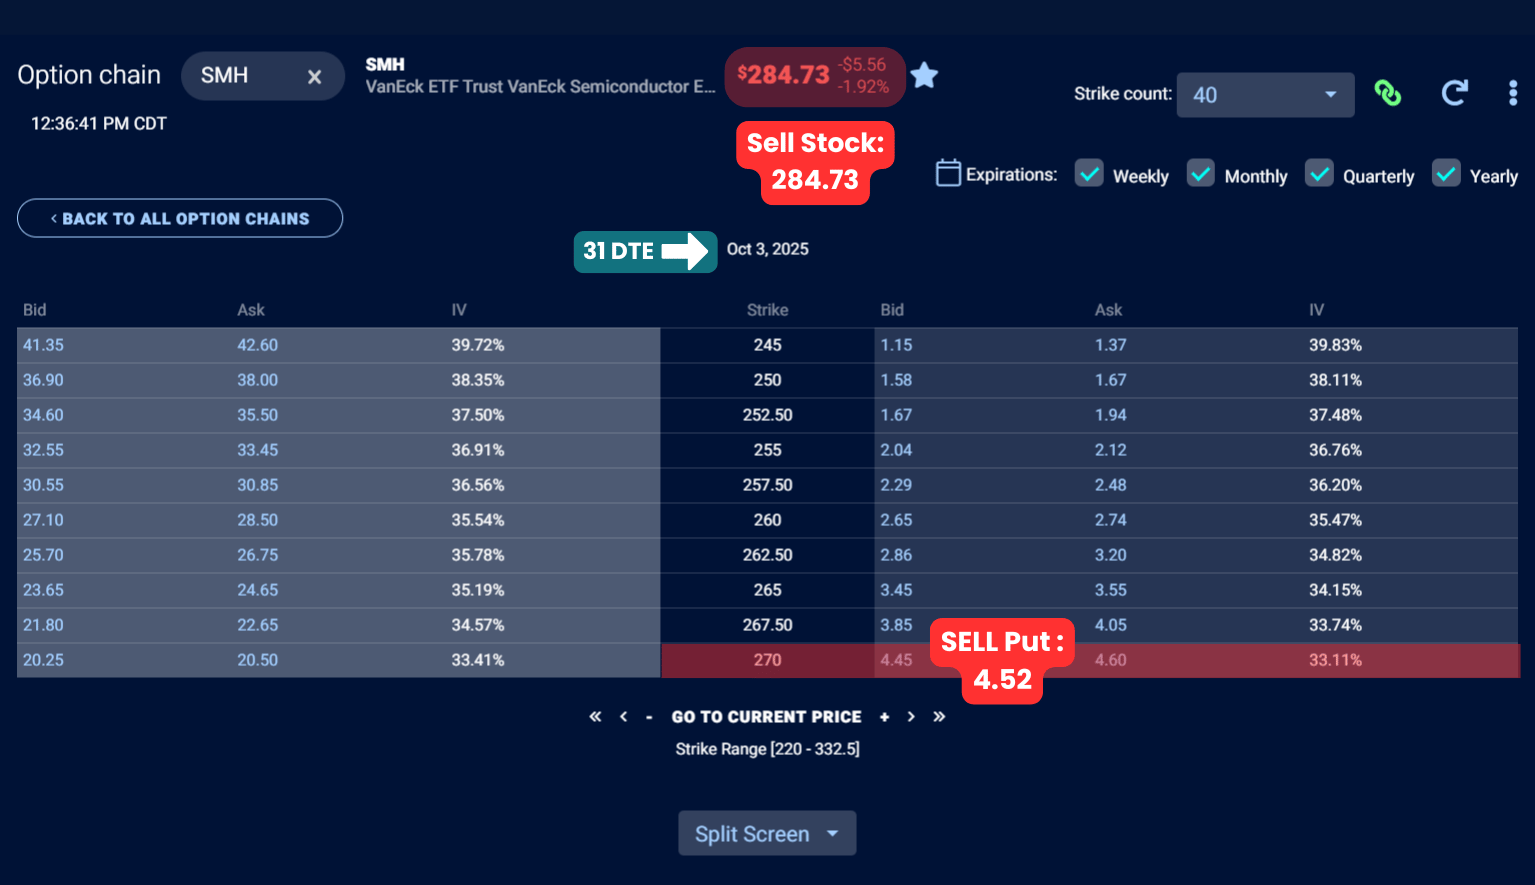
Trade Details
We’re going to assume we got filled at the midpoint on this trade. When trading options, always start at the midpoint and work your way up or down in penny or nickel increments until you get filled. Read more about options liquidity here.
Here are the details of the trade we just put on:
- Sell 100 shares of SMH @ $284.73
- Expiration: 31 days (Oct 3, 2025)
- Sell 270 Put @ $4.52 ($452 total credit)
Payoff Profile:
- Breakeven: $284.73 + $4.52 = $289.25
- Max Profit: ($284.73 – $270) + $4.52 = $19.25 × 100 = $1,925
- Max Loss: Unlimited (if SMH rallies)
- Profit Zone: Any price at or below $289.25 at expiration
- Risk/Reward: Unlimited risk to make $1,925 max
Now let’s explore a couple of trade outcomes.
SMH Covered Put: Positive Outcome
Let’s fast-forward 31 days to expiration. SMH sold off as expected and finished at $270, right at our put strike. The short put expired worthless, and the short stock booked solid gains.
Here’s how the trade played out:
- Expiration: 31 days → 0
- Strike Price: $270
- Stock Price: $284.73 → $270 📉
- Option Price: $4.52 → $0.00 📉
- Premium Kept: $452
- Short Stock Gain: $1,473
- Total Profit: $1,925
This is the ideal outcome for a covered put. We captured the full put premium and profit from the stock’s drop, maxing out the trade at $1,925.
Winning Trade: Under the Hood
Let’s now see how this trade played out in real time:
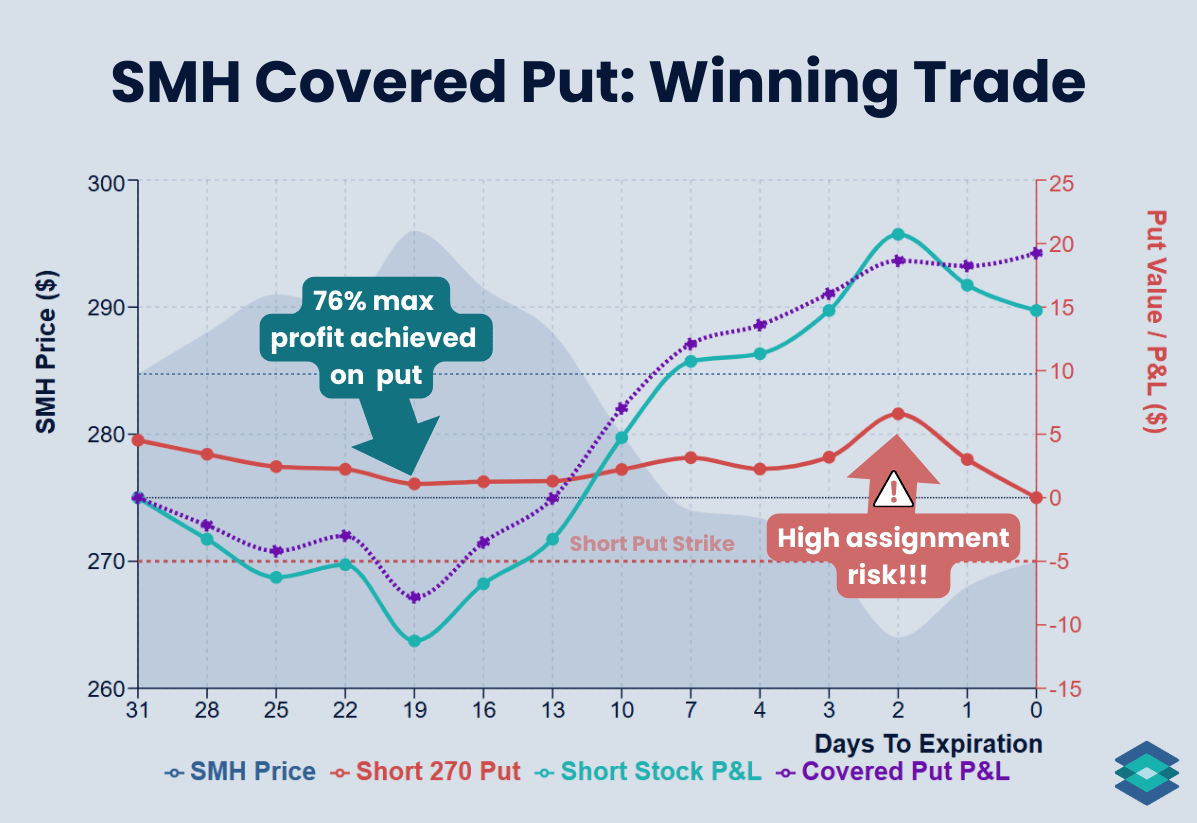
There are two key things to note about this trade, both marked on the chart above:
- Early profit opportunity: Only 12 days into the trade, the stock rallied hard, sending our short put from $4.52 down to $1.09. Closing there would have locked in a $343 profit (about 76% of max profit) and reopened the door for further gains if the stock collapsed again — which it did.
- Assignment risk near expiration: With just 2 days left, the stock was at $264 against our $270 strike, putting the option $6 in the money. Assignment risk was high, and assignment would have flattened the position by offsetting our short stock.
Notice how once the stock falls below the short put strike, profits are capped, while a straight short stock would keep gaining. In this case, the stock rallied into expiration and closed right at $270, letting us keep the short put premium and ultimately earn more than we would have from the short stock alone.
In the real world, an at the money American style option has about a decent chance of being assigned at expiration. I would have bought this put back, unless I wanted to neutralized the position. This is known as 'pin risk'.
SMH Covered Put: Negative Outcome
Fast-forward 31 days, and instead of drifting lower, SMH staged a sharp rally. By expiration, the ETF had climbed to $300, blowing past our breakeven and turning the trade into a loser.
Here’s how the trade played out:
- Expiration: 31 days → 0
- Strike Price: $270
- Stock Price: $284.73 → $300 📈
- Option Price: $4.52 → $0.00 (expired worthless)
- Premium Kept: $452
- Short Stock Loss: –$1,527
- Net Result: –$1,075
This is the risk with a covered put. Losses on the short stock quickly outweighed the small premium collected. Since upside risk is unlimited, the trade can snowball if the stock rallies hard.
Losing Trade: Under the Hood
And here’s how our covered put played out in real time:

This chart shows how, as SMH rallied, the $4.52 premium from the short put did little to offset losses. Once the stock moves beyond a certain point, the short put stops helping, and we’re essentially married to the stock price. The gap between short stock P&L and covered put P&L makes this clear.
Managing a Covered Put
Like most short option strategies, a covered put has a few possible management paths depending on how the trade plays out:
- Let the put expire worthless: If the short put is out of the money at expiration, simply let it expire. You keep the full premium collected, and the short stock position remains open.
- Roll to a different strike: If you want to collect more credit or adjust risk, you can roll the put to another strike via a vertical spread. Rolling higher brings in more premium but caps profits sooner, while rolling lower collects less but gives the stock more room.
- Roll to a later expiration: If the setup is working and you want to extend the trade, roll the short put out in time via a calendar spread. This allows you to keep collecting premium while staying with your bearish thesis.
- Assignment: If assigned, the short put cancels the short stock and leaves you flat.
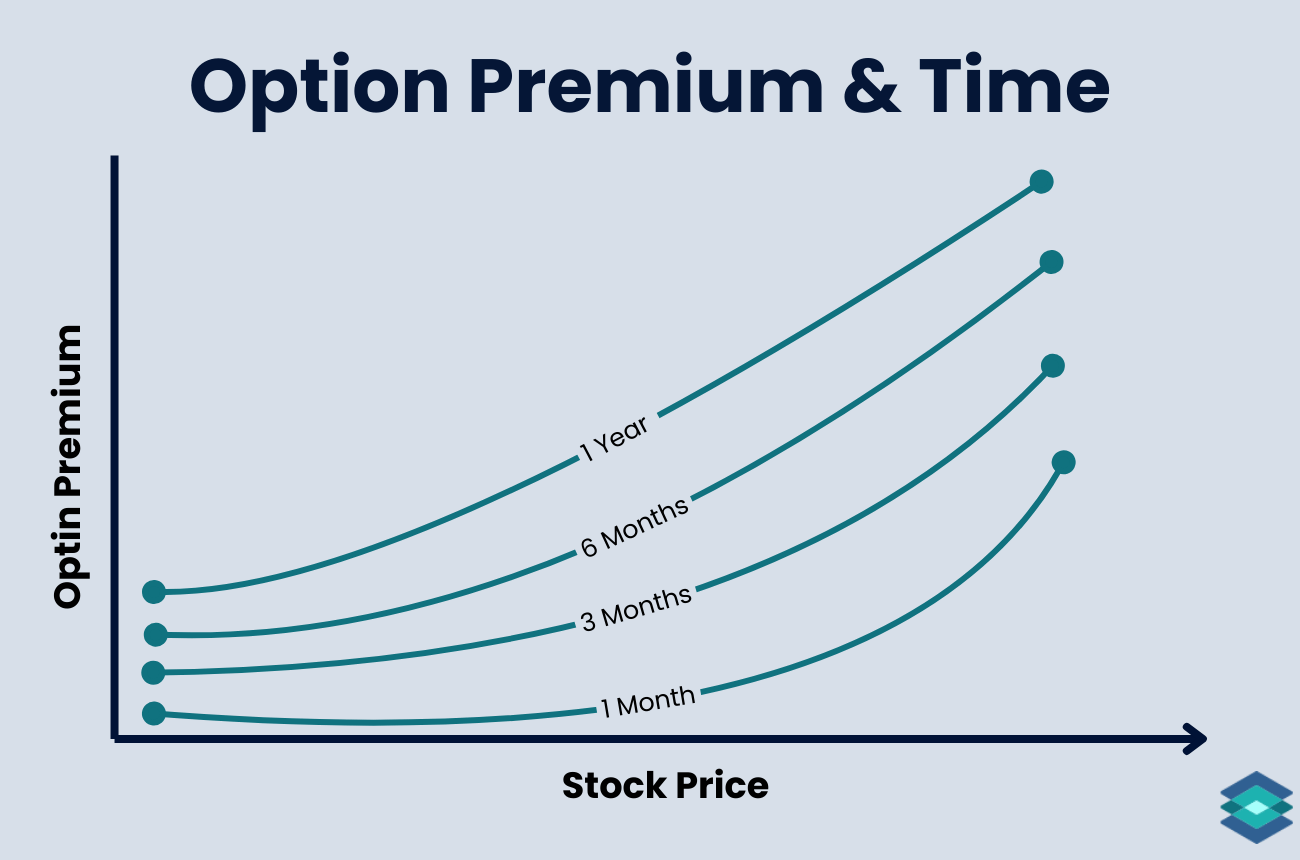
Time Decay and Theta
Theta is the option Greek that tells us how much an option is predicted to lose in value each day, assuming price and implied volatility stay the same. Theta is the reason that selling options can be profitable: option values naturally erode as expiration approaches.
For short option traders, this daily decay works in your favor. Each day that passes without a big move in price or volatility allows you to keep more of the premium you collected. The effect accelerates as expiration draws near, which is why many traders target options with 30 to 60 days to expiration.
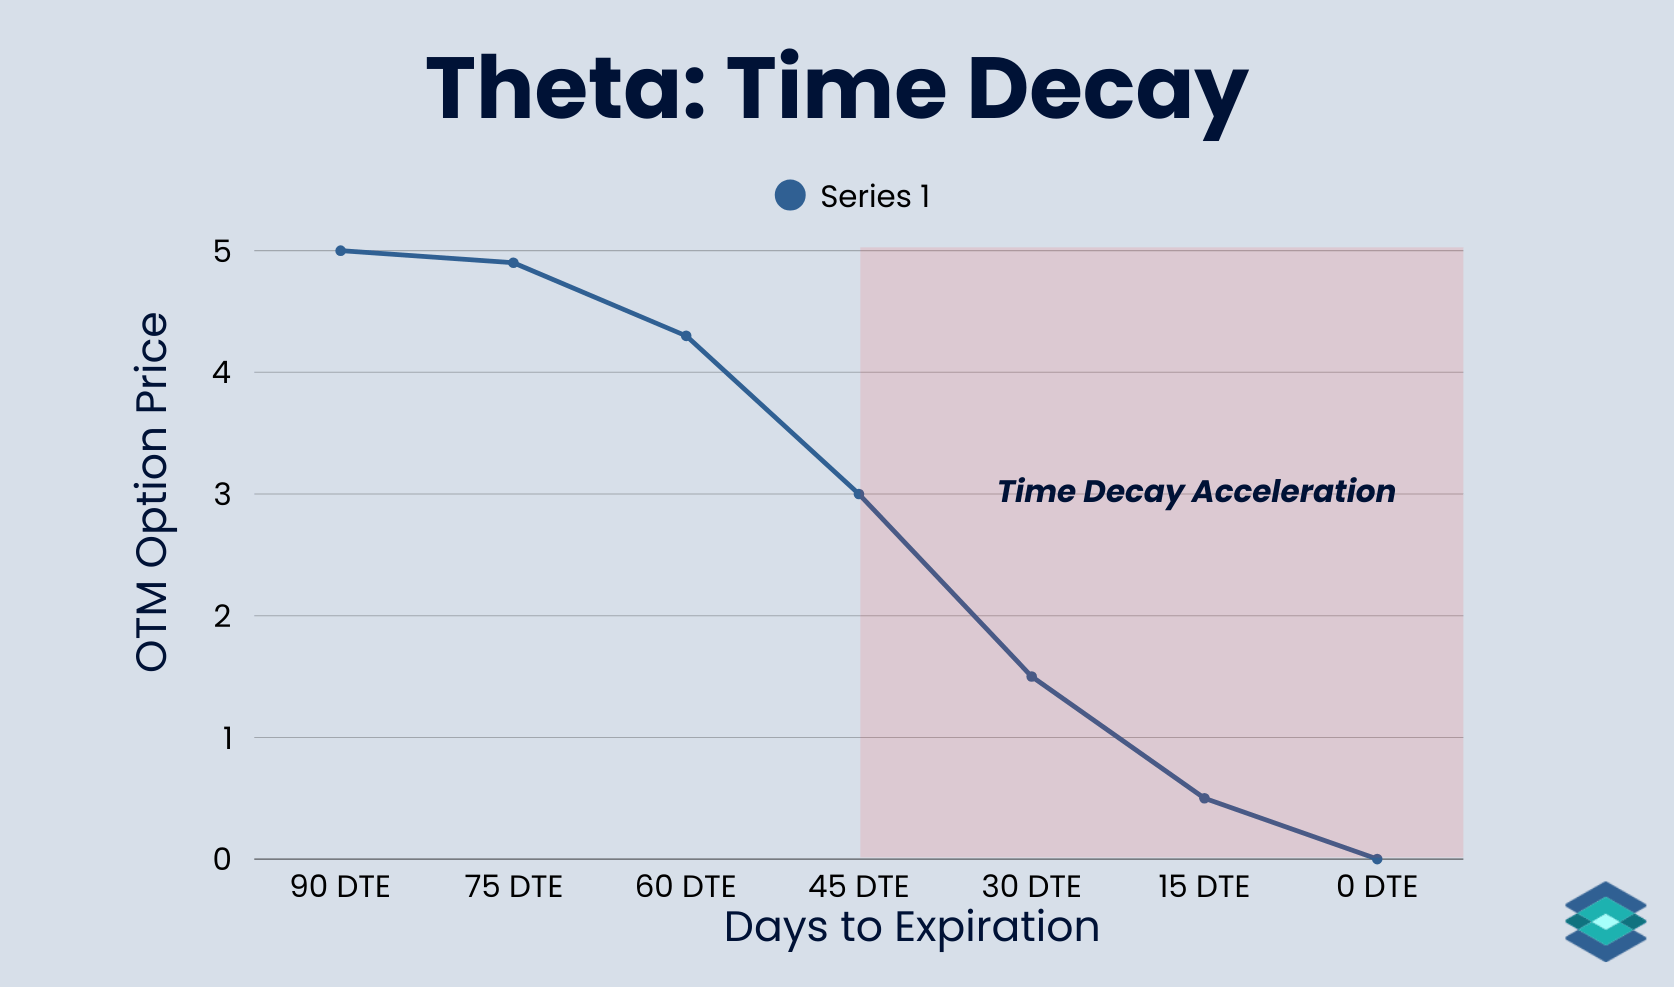
The flip side is that if the underlying makes a sharp move or volatility spikes, those losses can easily overwhelm the steady drip of theta decay. Theta is best seen as a tailwind, not a guarantee.
Choosing Your Strike Price & Deltas
In options trading, delta is the option Greek that refers to how much an option's value may change given a $1 move up or down in the underlying asset. Delta also tells us:
- The number of shares an option ‘trades like’
- The probability an option has of expiring in the money
A good rule of thumb is to sell puts with a delta around 0.15–0.25. This keeps assignment risk low but still provides a meaningful premium.
Another way to think about it is by standard deviation: a 1-standard deviation move typically lines up with a 16-delta option, which means there’s roughly an 84% chance the option expires out of the money.
Selling Options and Implied Volatility
In options trading, implied volatility (IV) represents the market’s expectation of future price movement. You don’t want to sell options when IV is historically low. You want to sell them when IV is elevated and expected to decrease.
Some examples include:
- Before an earnings call
- Ahead of major economic releases (jobs report, inflation data)
- Leading up to Federal Reserve announcements
So, how do you know if IV is historically high? Traders look at IV Rank. IV Rank shows where today’s implied volatility sits compared to its range over the past year.
A good rule of thumb:
- IV Rank above 50% → Premium is relatively expensive, better time to sell options
- IV Rank below 25% → Premium is relatively cheap, avoid selling options
Covered Put and The Greeks
In options trading, the Greeks are a set of risk metrics that help estimate how an option’s price will respond to changes in key market variables. Here are the five most important Greeks to know:
- Delta – shows how much the option price changes for a $1 move in the stock.
- Gamma – shows how much delta shifts when the stock moves $1.
- Theta – shows how much the option loses in value each day from time decay.
- Vega – shows how much the option price changes for a 1% change in implied volatility.
- Rho – shows how much the option price changes for a 1% change in interest rates.
And here is the relationship between covered puts and these Greeks:
Covered Put vs Covered Call
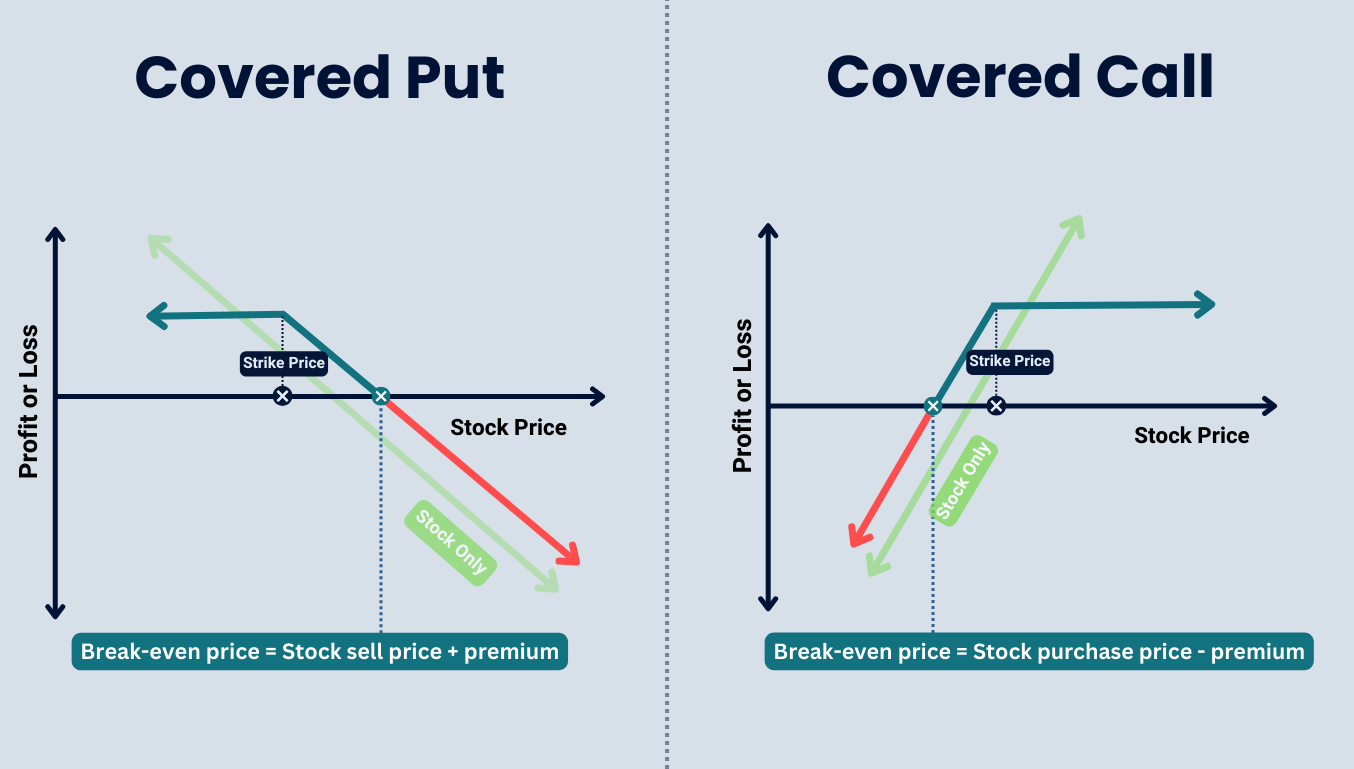
The covered put is a bearish income trade made up of short stock and a short put. You profit if the stock drifts lower or stays flat, but gains are capped once the stock falls below the strike.
- Unlimited risk if the stock rallies higher
- Premium collected slightly improves breakeven
The covered call is the bullish mirror image, combining long stock with a short call. You profit if the stock drifts higher or stays flat, but upside is capped once the stock moves above the strike.
- Substantial downside risk if the stock sells off
- Premium collected provides a small cushion
⚠️ Covered puts involve unlimited risk on the upside since short stock losses have no cap. While the short put provides income and slightly improves breakeven, it also caps profits if the stock falls below the strike. This strategy is not suitable for all investors. Outcomes can also be affected by assignment risk, commissions, fees, and slippage, which are not reflected in the examples. Always read The Characteristics and Risks of Standardized Options before trading.
.svg)
.svg)
.svg)
.svg)
.svg)
.svg)
FAQ
A covered put is a bearish strategy where you sell short 100 shares of stock and then sell one put against it. The short put brings in income while slightly improving breakeven.
Very risky. Risk is unlimited on the upside since the short stock can keep losing money if the stock rallies. The short put only offsets risk by the premium collected.
It’s a bearish strategy. You profit if the stock falls or drifts sideways, but losses stack up quickly if the stock moves higher.
Let’s say you’re short 100 shares of ABC at $100. To bring in income, you sell the 95 put for $2, collecting $200 in premium while holding the short stock.
A covered put is the mirror opposite of a covered call. The covered put is bearish (short stock + short put), while the covered call is bullish (long stock + short call).
A protective put involves long stock and a long put. A covered call involves long stock and a short out of the money call. The protective put is more expensive but provides much more downside protection. The covered call limits upside and offers little cushion on the downside.
A covered call works by buying 100 shares of stock and selling a call option, typically out of the money. If the stock price remains below the strike price of the sold call on option expiration, you keep the full premium from the option sale.